
Tags
San Diego Unified School District, San Diego Unified School District Superintendent Cindy Marten

This week we will be using Sunday Reads to launch a 3 part series of articles by a special confidential resource named “Inside Unified”. This series will analyze the actual student and school performance data, and its negative educational ramifications during the current San Diego Unified School District (SDUSD) Superintendent Cindy Marten 2013/14 through 2018/19 school year period.
Today is Part 1 of the 3 part series and features the SDUSD Advanced Placement (AP) and California Assessment of Student Performance and Progress (CAASPP) trending analysis and conclusions.
Part 2 will be posted on Tuesday, March 2, 2021 and focus on SDUSD Grades and Grading Policy.
Part 3 will be posted on Thursday, March 4, 2021 with a commentary examining the credibility of the UC A-G trend data over Cindy Marten’s tenure as SDUSD Superintendent.
All of the data enclosed in this report is taken directly from Federal, State and/or SDUSD created documentation.
It is astonishing to read the statements of public support for Superintendent Cindy Marten—especially the picking and choosing of data points within the narratives to spin a tale of exceptionalism. I think that when a person is applying for one of the most important jobs in the country he or she should have to provide their complete resume so that the public can assess the true impact and intention of the leader. Over the course of the next week, I will attempt to shed some light on data points like Advanced Placement (AP) trends, International Baccalaureate (IB) trends, CAASPP (yearly state testing) trends, grading trends, UC a-g with a C analysis and other trends that tell a more complete story. This initial analysis looks at AP, IB and CAASPP.
Advanced placement, international baccalaureate and state/federal CAASPP scores may not be the total measure of a student, but certainly looking at trend data over time reveals the impacts that a leader has had on a system. In the case of mastery metrics at the high school level in San Diego Unified, an examination of the advanced placement, international baccalaureate and CAASPP reveals many things:
The following comprehensive and small schools are included in this analysis—atypical and alternative schools are not included as the sample sizes are many times too small to report. Three schools below do not offer or have AP numbers high enough to include in the analysis and have been removed from the AP analysis below.
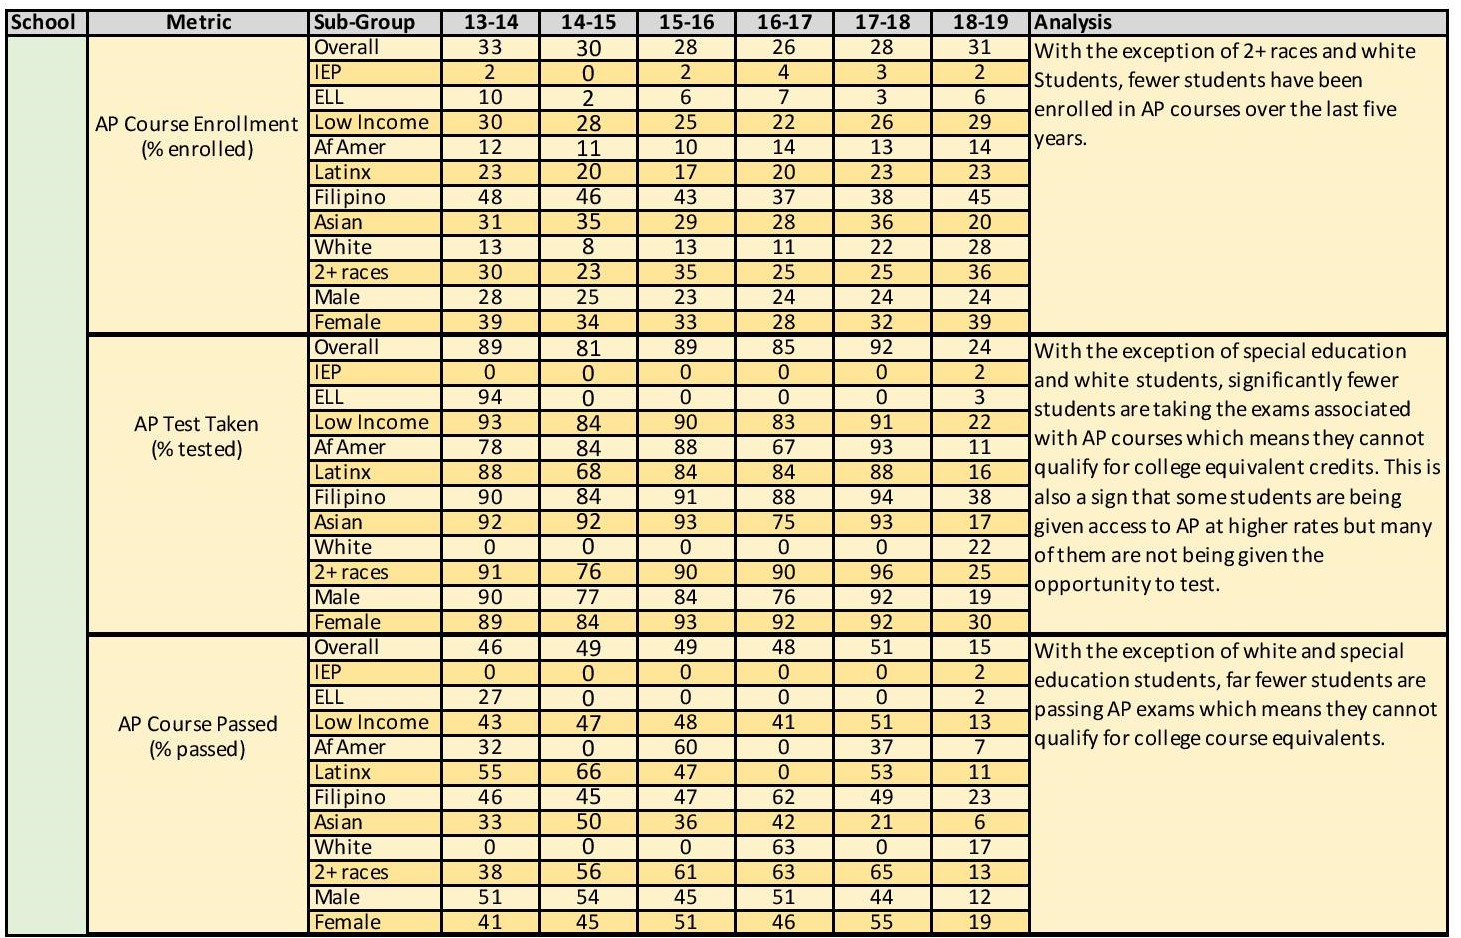
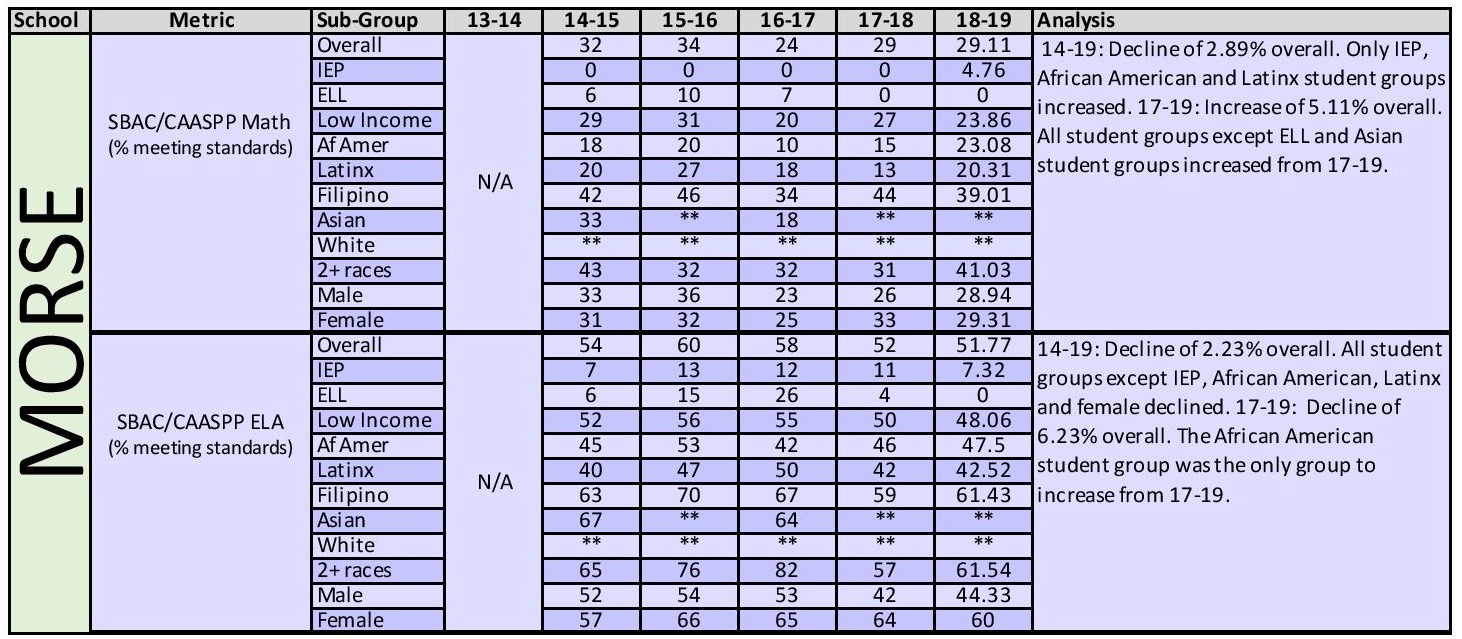
Using Morse High School. here is an example of the data compiled for each school listed:
Please click on each of the school links below for the data analysis:
- Clairemont
- Crawford
- Henry
- Hoover
- Kearny College Connections (no AP)
- Kearny Digital Design (no AP)
- Kearny Engineering Innovation and Design (no AP)
- Kearny Science Connections and Technology
- La Jolla
- Lincoln
- Madison
- Mira Mesa
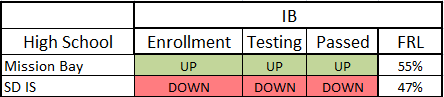
- Mission Bay (+ IB)
- Morse
- Pt. Loma
- SCPA
- Scripps Ranch
- San Diego Business/Leadership
- San Diego International Studies (+ IB)
- San Diego Science & Technology
- Serra
- University City
Over the tenure of Superintendent Cindy Marten:
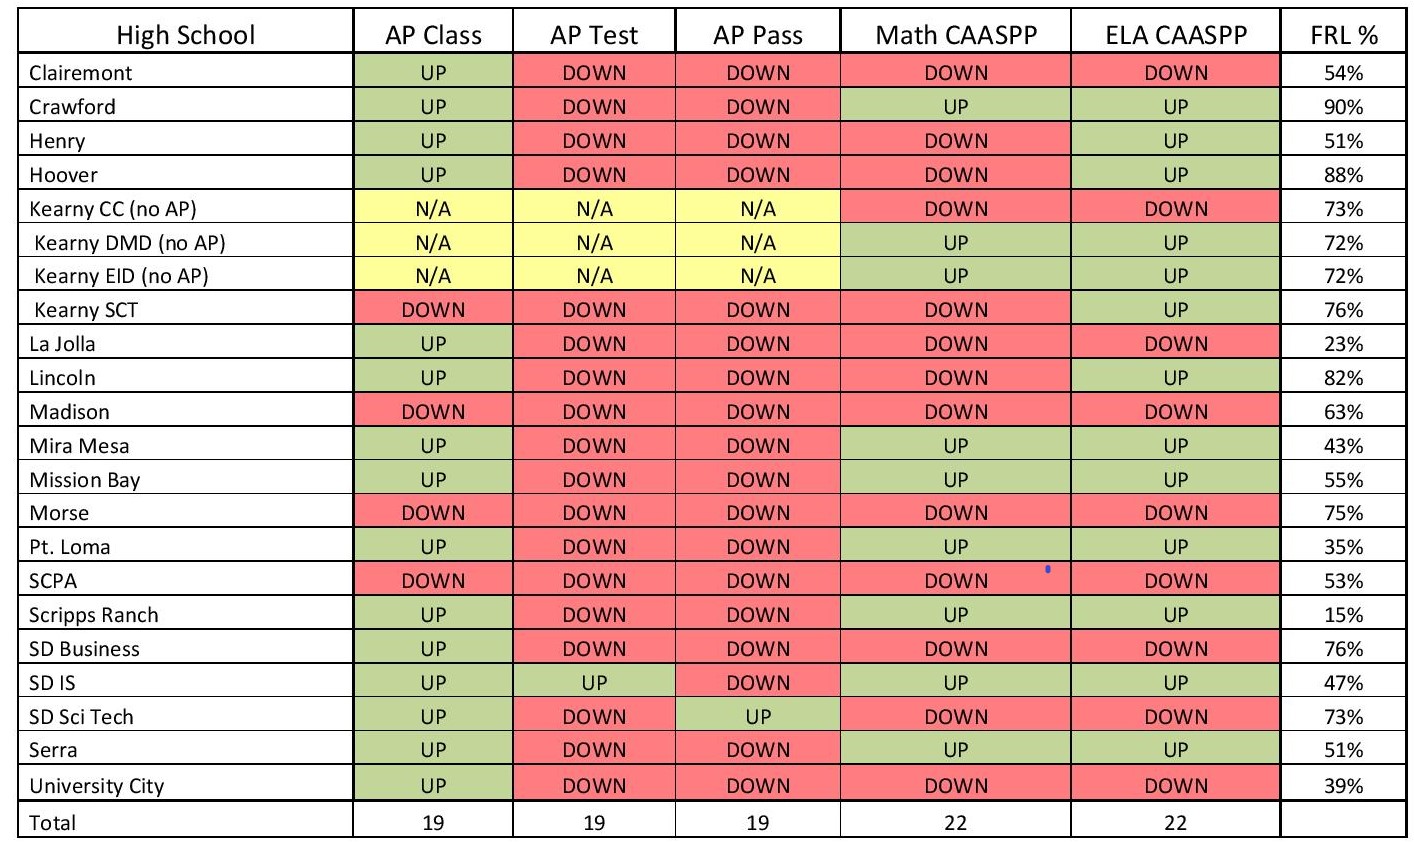
Out of 19 high schools above, 15 (79%) increased advanced placement enrollment rates from 2014-2019.
Out of 19 high schools above, 18 (95%) decreased advanced placement test taking from 2014-2019.
Out of 19 high schools above, 18 (95%) decreased advanced placement test passing from 2014-2019.
Out of the 22 high schools above, 12 (55%) decreased in math proficiency as measured by the CAASPP from 2014-2019.
Out of the 22 high schools above, 8 (36%) decreased in ELA proficiency as measured by the CAASPP from 2014-2019.
Here is a chart illustrating the above performance data for the High Schools selected:
Here is a PDF list of the schools by category: Data Trend Schools by Category
From another confidential source, here is additional analysis and observations we received using “The Nations Report Card” the National Assessment of Educational Progress (NAEP) and CAASPP data for SDUSD during the Marten period:
Students in SDUSD may have done slightly better on the NAEP than some other urban districts (Marten and the Board always cite the 2017 data because it was better than the 2019, where they shared the “top” spot with six other urban districts).
However, the actual proficiency rates were low (between 35% to 43%, depending on age and subject), and the significant performance gaps between White and African America/Black or Hispanic students were unchanged between 2003 and 2019 (and actually worse between socioeconomically advantaged versus disadvantaged student).
Link: 2019 SDUSD NAEP TUDA Results
Similarly, between 2016 and 2019, the percentage of students meeting standards in English Language Arts was essentially unchanged (from 56.0% to 57.1%) and hardly improved (44.4% to 48.5%) in Math, according to the CAASPP (aka SBAC). And achievement gaps were large and persistent there as well.
Link: CAASPP Dash View Report 1
40% of SDUSD’s Class of 2020 did not meet the standards in ELA and 64% of them did not meet the standards in Math. For African American/Black students, a whopping 64% of the Class of 2020 didn’t meet the standards in ELA and an astounding 85% didn’t meet the standards in Math. All of this brings into question the validity of the SDUSD “graduation rate.”
Link: CAASP Dash View Report 2
Conclusions:
- This data has serious implications for students as failure to test or pass tests denies access to potential college equivalents that some higher education institutions recognize/offer. In addition, whether or not we agree that “kids are not a test score” certainly this trend data reveals significant issues with systemic implementation.
- Student achievement as measured by AP and CAASPP tests were higher under previous Superintendent Kowba when he departed in 2013-2014. Yes, we know the test shifted from the SBAC to the CAASPP but certainly at some point under the tenure of Superintendent Marten something should have improved for kids.
- Jamming more kids in AP classes isn’t transforming the instruction in the classroom which directly leads to student subject mastery. It’s harder work than enrollment because it requires supporting changes in teacher mindset and instructional practices. The argument that “exposure to AP is exposure to rigor” is nonsense. Many traditional AP teachers assign more work rather as “rigor” rather than design the deeper learning that leads to subject mastery.
- There is a disproportionate level of achievement across subgroups in AP and CAASPP. Look at each of the schools by levels of poverty. The disparity between those who live above and below the poverty line is evident.
In summary, it is clear that more schools that showed slight signs of improvement were located in communities living above the poverty line. The truth is that if classroom instruction was transforming in SDUSD wouldn’t students perform better on CAASPP exams? Kids aren’t a test score but certainly there should be improvements if an exceptional leader was impacting the system.
Here’s the bottom line: There is evidence of exceptional leadership all over the San Diego County and across the nation. Those exceptional leaders put the needs of students and families over the needs of their own political ambitions as demonstrated by their careful, thoughtful and safe reopening strategies during this time of crisis.
These leaders did not use their alma mater (UCSD) as a veil to give them cover for inaction. Instead they used science and actionable data to make sure that students were back in the classroom with their teachers. Was it perfect? No, but it was a signal that they put kids first.
It’s astonishing that so much attention is given to a superintendent who has done nothing but polish her photo ops. Why aren’t we looking at the real positive outliers? Their test scores may not be perfect, but their actions match their words and promises: Some examples include Superintendent David Miyashiro from Cajon Valley Union School District, Superintendent Alberto M. Carvalho from Miami-Dade, Superintendent Benjamin Churchill from Carlsbad Unified or Superintendent Matthew Doyle from Vista Unified School District.
In addition, if Linda Darling-Hammond and Dr. Pedro Noguera are going to pick and choose their data points for media reports supporting the SDUSD superintendent, I think we should look at all of the data over her tenure and see if the narrative matches the truth—especially for the African American students in SDUSD.
Stay tuned for Part 2 on Tuesday, March 2, 2021 where I will focus on SDUSD Grades and Grading Policy.
#NoMarten
_________________________________________________________
IF
- Your family has been injured by the San Diego Unified School District, go to the District Deeds Complaint Forms page to find instructions to fight for your Civil Rights!
- You want to be sure you don’t miss an issue of District Deeds, click the “follow” button below and you will get an email automatically when an article is published on District Deeds.
- If you prefer social media, click on Facebook, Twitter and LinkedIn and follow District Deeds!!!

Pingback: Whistleblower “Inside Unified” 3 Part Series – Part 2: The REAL San Diego Unified School District Grades and Grading Policy | District Deeds